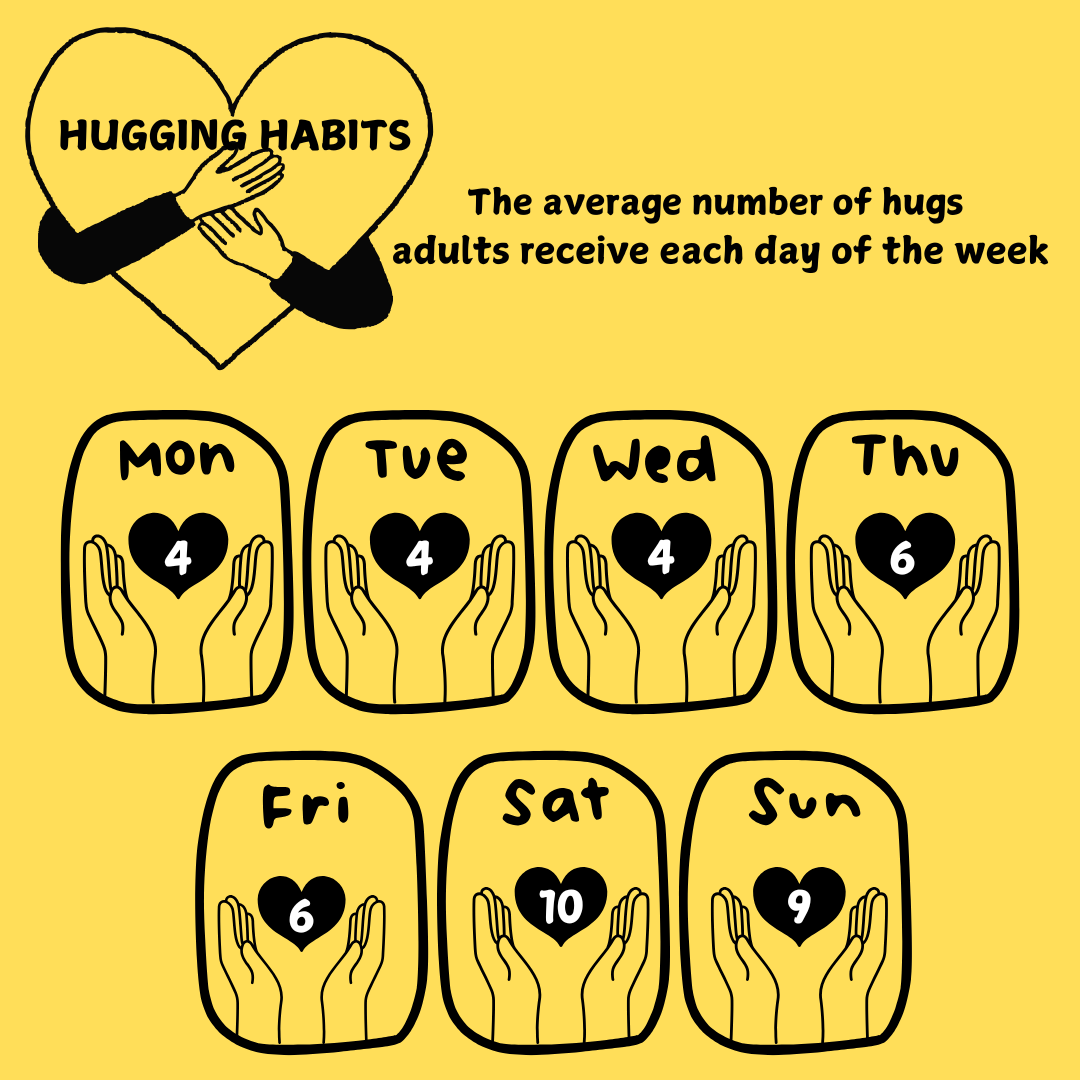
Data Viz 11: Hugging Habits
Hugs are small but powerful acts of connection, and our latest infographic highlights how their frequency varies throughout the week. According to a scientific study published in the Journal of Nonverbal Behavior; adults hug at different frequencies throughout the week.
Data Viz 10: The Big Money Split
Former President Trump is now President-elect Trump. Securing his title took more than just votes. A pathway paved in dollar bills, funded by Silicon Valley and global financial investors helped propel his efforts to the White House. VP Kamala Harris also managed to nab billionaires and heavy hitters in Big Tech during her campaign, but Trump’s fundraising efforts spanned both new and old money.
The Status of TikTok
This GGD graphic presents the number of active monthly users on TikTok around the world: over 1.5 Billion.
Visual 09: Megacities in 2050
In 2050, another 2.5 billion people will be added to the planet’s urban areas, with the majority of growth taking place in Asian and African countries. Using data from the UN and the Global Cities Institute, the visualization above highlights the world’s top megacities.
Visual 03: Covid-19 Vaccinations
In total, over 205 million vaccine doses have been given across 92 countries. An estimated 6.44 million doses are believed to be administered daily. This data visual shows how out of all countries, Israel’s population has the highest rate of residents vaccinated. The latest figures for global vaccinations come from Bloomberg’s COVID-19 Tracker and Statista.